![]()
Viewing Web Traffic Analytics Data
The Web traffic analytics feature provides two basic types of data:
Page data - Page Level Web Traffic Analytics Data
Site data - Site Level Web Traffic Analytics Data
Page Level Web Traffic Analytics Data
After you enable Web traffic analytics tracking, your provider retains data on every visited page (that is, a unique URL) such as http://dev.ektron.com/articles.aspx or http://dev.ektron.com/template.aspx?id=6572). Data is tracked when the quicklink is used, as well as any alias assigned to the content. See Also: Creating User-Friendly URLs with Aliasing
You can view any page’s Web traffic analytics data from the following locations.
Viewing Page-Level Web Traffic Analytics from the Site
Viewing Page-Level Web Traffic Analytics from a PageBuilder Page
Viewing Page-Level Web Traffic Analytics from the Workarea
Viewing Page-Level Web Traffic Analytics from the Site
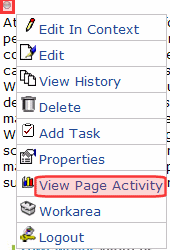
Any authorized user can view Web traffic analytics for a page on your Web site by following these steps.
1. Log in to the Web site.
2. Navigate to the page whose Web traffic analytics data you wish to view.
3. Hover the cursor over the Web Site Content menu. See Also: The Web Site Content Menu
4. Choose View Page Activity, as shown below.
The SEO page’s Traffic tab appears.
The SEO Page’s Traffic Tab
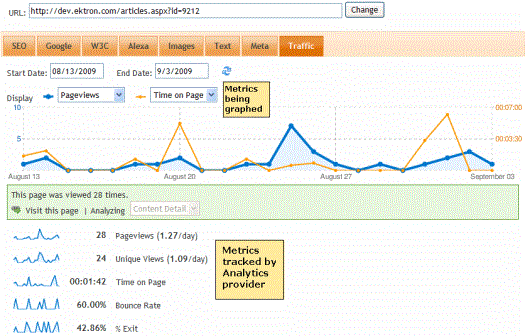
The Traffic tab of the SEO control graphs the Web traffic analytics data of any two search criteria. Below the graph is data for the five visit criteria tracked by the Web traffic analytics provider.
Visit Data
Pageviews - number of pageviews for this page over the selected date range
Unique pageviews - number of unique visitors to this page over the selected date range
Average time on page - how long a visitor spent on the page. It is calculated by subtracting the initial view time for this page from the initial view time of the subsequent page. So, this metric does not apply to exit pages.
Bounce rate - the percentage of single-page visits (that is, visits in which the visitor exited your site from the entrance page)
% Exit - the percentage of site exits that occurred from this page
Note that you can change the date range, as well as either search criterion (Pageviews and Time on Page in the example above).
You can also replace the URL with a different one, and view the page being analyzed (by clicking Visit this page in the green bar).
Viewing Page-Level Web Traffic Analytics from a PageBuilder Page
Any authorized user can view Web traffic analytics for a PageBuilder page by following these steps.
Note: You cannot drag and drop the Analytics widget onto a PageBuilder page.
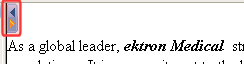
1. Use the right arrow button (circled below) to open the PageBuilder menu. See Also: Building PageBuilder Pages
2. From the menu, choose View > Analytics.
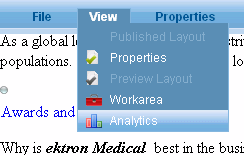
3. The SEO page’s Traffic tab appears.
See Also: The SEO Page’s Traffic Tab
Viewing Page-Level Web Traffic Analytics from the Workarea
The Ektron CMS400.NET Workarea provides two page-level views of Web traffic analytics data.
The View Content History screen - compares Web traffic analytics data for any two published versions
The Analytics toolbar button - displays the SEO page’s Traffic tab. See The SEO Page’s Traffic Tab.
To view a content item’s Web traffic analytics data from the Ektron CMS400.NET Workarea, follow these steps.
1. Navigate to the folder containing the content whose Web traffic analytics data you want to view.
2. Click the content item.
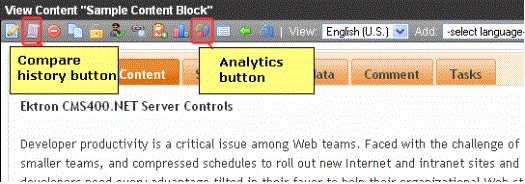
3. To compare Web traffic analytics data any two published versions, click History ( ). See Also: Comparing Two Published Versions of Content
To view Web traffic analytics for the currently published version, click Analytics ( ). When you do, you see the Traffic tab of the SEO page. See Also: The SEO Page’s Traffic Tab
Comparing Two Published Versions of Content
On the View Content History screen, blue and orange radio buttons appear next to each published version of content, as shown below.
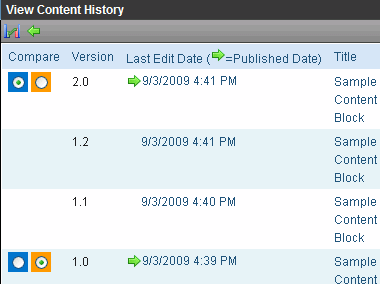
To compare Web traffic analytics data, click the appropriately-colored radio button next to each version, then click Compare ( ). The Compare screen for the two versions appears, as shown below.
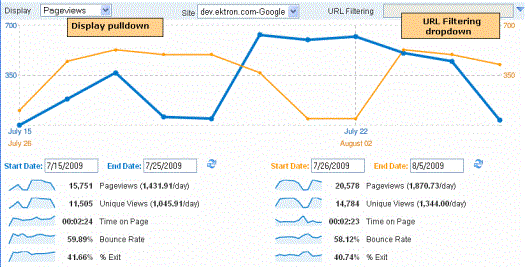
You can change the date range for each content version. You can also
Use the Display pull-down to graph any visit data. See Visit Data
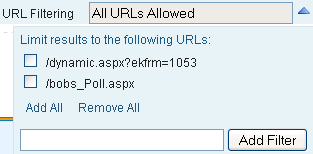
Click the URL Filtering tab to select the URLs being displayed. See Also: URL Filtering
URL Filtering
Any content item can be viewed via several URLs, such as
its quicklink. See Also: A quicklink is a special kind of hyperlink that jumps to another content item on your Web site. (A regular hyperlink jumps to a Web page on the internet.)
manual alias
automatic alias See Also: Creating User-Friendly URLs with Aliasing
Note: While Regex-based aliases affect Analytics data, they do not appear on the URL Filtering tab.
The URL Filtering tab of the Compare Analytics screen lets you break down the data by each of these identifiers. So, for example, you can drill down to view only the data collected when site visitors accessed a page by typing its manual alias into the browser.
Site Level Web Traffic Analytics Data
You can view Web traffic analytics data for any site via the Analytics Report Widget and several reports. See Also: Widget Reference
Analytics Report Widget
You can drag and drop the Analytics Report Widget onto the Smart Desktop.
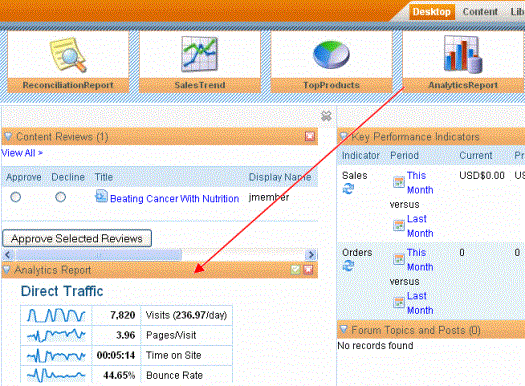
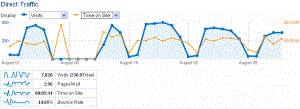
When you do, you initially see the Direct Traffic report for the past seven days. (See Also: Direct Traffic)
You can click Edit ( ) to change the display using any of the options shown below.
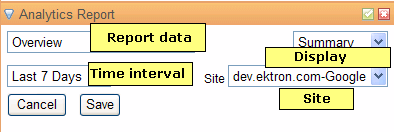
To learn about the report data options, see Site Report Descriptions.
Note that there are three time interval choices:
last 7 days (the default)
last 30 days
last 90 days
Site Report Descriptions
You can access site-level Analytics reports from within the Ektron CMS400.NET Workarea by selecting Reports > Site Analytics.
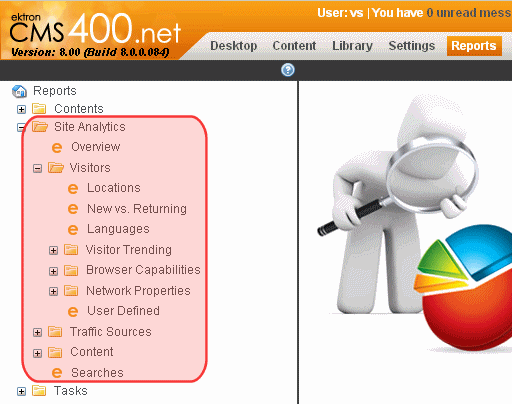
The site level reports are described below.
Note: The following text was adapted from Google Analytics Help Center (http://www.google.com/support/analytics/). Check that site for additional details on the reports.
|
Report |
Description |
|
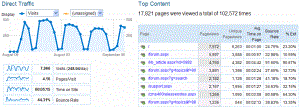
Direct traffic on left side, top content on the right. See Also: Direct Traffic, Top Content; Analytics |
|
|
|
|
|
Search terms used by site visitors to find content on your site. Note that this data is not retrieved from Google Analytics. Instead, it is retrieved from Ektron CMS400.NET’s site search. |
|
|
Visitors The number of new and returning visitors who came to your site and how extensively they interacted with your content. This traffic overview allows you to view aspects of visit quality (i.e. average pageviews, time on site, bounce rate) and visit characteristics (i.e. first time visitors, returning visits).
|
|
|
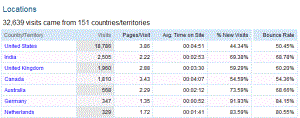
Countries of your site visitors. |
|
|
The number of visitors to your site who are new or returning. A high number of new visitors suggests that you are successful at driving traffic to your site, while a high number of return visitors suggests that the site content is engaging enough to keep visitors coming back. You can see how frequently visitors return and how many times they return in ‘Recency’ report and the ‘Loyalty report’, both under ‘New vs. Returning’ in the Visitors section. |
|
|
Uses the language as provided by the HTTP Request for the browser to determine site visitors’ language. Values are given in 2- or 4-character language code (for example, en-br for British English). This report captures the preferred language that visitors have configured on their computers. Understanding who your visitors are is crucial to developing the right content and optimizing your marketing spend. Many times, geo-location is not enough. Many countries have diverse populations speaking different languages which present important market targeting opportunities. |
|
|
If you modified the tracking code to provide a user-defined segment, this field identifies that segment by the string you provide when setting up a user-defined segment. |
|
|
Visitor Trending
|
|
|
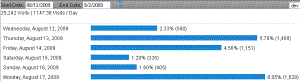
The number of visits your site receives is the most basic measure of how effectively you promote your site. Starting and stopping ads, changing your keyword buys, viral marketing events, and search rank are some examples of factors that influence the number of visits your site receives. |
|
|
The number of unduplicated (counted only once) visitors to your Web site over the specified time period. A Unique Visitor is determined using cookies. |
|
|
The total number of pages viewed on your site. It is a general measure of how much your site is used. It is more useful as a basic indicator of the traffic load on your site and server than as a marketing measure. |
|
|
Average pageviews is one way of measuring visit quality. A high Average Pageviews number suggests that visitors interact extensively with your site. A high Average Pageviews results from one or both of: Appropriately targeted traffic (that is, visitors who are interested in what your site offers) High quality content presented effectively Conversely, a low average pageviews indicates that the traffic coming to the site has not been appropriately targeted to what the site offers or that the site does not deliver what was promised to the visitor. |
|
|
One way of measuring visit quality. If visitors spend a long time visiting your site, they may be interacting with it extensively. However, Time on site can be misleading because visitors often leave browser windows open when they are not actually viewing or using your site. |
|
|
The percentage of single-page visits (that is, visits in which the person left your site from the entrance page). Bounce rate is a measure of visit quality, and a high bounce rate generally indicates that site entrance (landing) pages aren't relevant to your visitors. You can minimize Bounce Rates by tailoring landing pages to each keyword and ad that you run. Landing pages should provide the information and services that were promised in the ad copy. |
|
|
Optimizing your site for the appropriate technical capabilities helps make your site
|
|
|
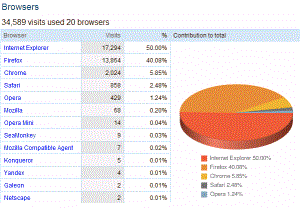
Browsers |
The browsers that your visitors use. |
|
The operating systems that your visitors use. |
|
|
The browser/operating system combinations that your visitors use. |
|
|
The number of screen colors your visitors use. |
|
|
The screen resolutions that your visitors use. |
|
|
The versions of Flash that your visitors have installed. |
|
|
Whether Java is supported on your visitors' platforms. |
|
|
Network Properties
|
|
|
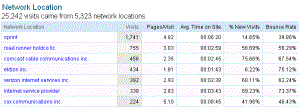
The internet service providers that your visitors use. This report allows you to track the internet service provider (ISP) domains to which the user resolves. The domain is determined by the internet service that owns the user's internet protocol (IP) identifier. |
|
|
Hosts from which people are visiting your site. Hostnames sometimes provide insight into organizations that are interested in what you offer. |
|
|
Connection speeds that your visitors are using. Optimizing your site so that it loads quickly for most visitors can result in higher conversion rates and more sales. |
|
|
Traffic Sources This section provides an overview of the different kinds of sources that send traffic to your site. The graph shows traffic trends; the pie-chart and tables show what is driving the trends.
|
|
|
Visits from people who clicked a bookmark to come to your site or who typed your site URL directly into their browser. Direct traffic can include visitors recruited via offline (i.e. print, television) campaigns. |
|
|
Externals sites from which visitors linked to your site. |
|
|
Visitors who clicked to your site from a search engine result page. |
|
|
Visitors referred from search engines, sites, and tagged links. The graph shows the overall trends while the table shows the specific sources (i.e. search engines, sites, and tagged links) driving the trends. |
|
|
Compares traffic from search keywords to overall traffic to your site. |
|
|
How people referred from your configured campaigns compare to the “average” visitor to your site. The graph shows overall trends, while the table lists each configured campaign. Since all traffic in this report results from campaigns that you explicitly control, you can use this information to add or delete campaigns, or to determine the effectiveness of tests that you have set up using custom tags. |
|
|
Compares your AdWords ads (and configured campaigns in which you use the “content” tag) against each other. This report shows you which ad copy (in AdWords ads or in configured campaigns) is most effective. Ads with high clickthrough rates show that the copy is effective at getting the user to click, while high bounce rates, for example, indicate a need for landing pages that are consistent with what the ad promises. |
|
|
Content Provides an overview of pageview volume and lists the pages (Top Content) that were most responsible for driving pageviews. You can also reach some useful reports that reveal how users interact with your site and statistics related to how they found your site in the first place. Note: Content reports include a link icon (
|
|
|
The most commonly viewed pages on your site, and how they are used. The table lists all pages which were viewed on your site. A high bounce rate indicates a landing page that should be redesigned or tailored to the specific ad which links to it. A high 'Time on Page' may indicate content that is particularly interesting to visitors. The significance of exits varies according to each page. For example, it may be common for visitors to exit your site from a receipt or “thank you” page because they have completed a conversion activity. In contrast, a high number of exits from a non-goal page (from a funnel page, for example) may indicate that the page is confusing or that it generates user errors. |
|
|
The most commonly viewed groups of pages on your site (grouped by title), and how they are used. This report provides the same information in the “Top Content” report, but aggregated by title tag value. |
|
|
Data on how effectively your landing pages entice visitors to click further into your site. You can lower bounce rates by tailoring landing pages to their associated ads and referral links and placing a clear call-to-action on each landing page. |
|
|
Pages from which people exit your site. The significance of an exit rate varies according to each page. For example, it may be common for visitors to exit your site from a receipt or “thank you” page because they have completed a conversion activity. In contrast, a large number of exits from a non-goal page (from a funnel page, for example) may indicate that the page is confusing or that it generates user errors |
|
 ) and a hyperlink. If you click the link icon, you
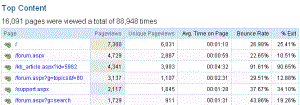


![]()